Inżynier i Fizyk Medyczny 2/2017 vol. 6
93
radiologia
/
radiology
artykuł naukowy
/
scientific paper
values were no changed between ACS and fixed mAs protocols.
The biggest differences were detected between UB and B filters
protocols (eg. teflon about 50HU, derlin about 45HU, acrylic –
about 25HU) and 2mm vs 3mmprotocols (eg. teflon about 20HU).
The CATPHAN images were used to choose which protocols will
be scanned using the CIRS phantom to define a relation between
HU and mass densities for particular materials.
The Philips object images were analysed for the image quali-
ty parameters: uniformity, SD and quantity parameter: HU. The
aim of that evaluation was to confirm that AEC (ACS) system
compensates image quality for the range of the patient sizes
(tab.3a. and tab.3b.).
The AEC should compensate image quality (noise level) in the
images in relation to different object sizes. The Philips CT scanner
uses the reference images to set mAs required to keep a consisten-
cy of image quality. The reference phantoms sizes used to perform
the reference images are assigned to particular protocols (eg. 16
cm for brain/head protocols, 26-33 cm for torso protocols) and
determine the exposure conditions. The results obtained during
measurements showed a big variation of SD in relation to the test
object size. There was from about 2.5HU until about 45HU (15cm-
50cm object size) dependently on: type of protocol, filter, anatom-
ical region, reference image assigned to a protocol. Uniformity ob-
tained for the different the object sizes was from about 1.4% until
about 50% respectively for the smallest and biggest test object.
The results received were also significantly different for HU when
the biggest object (50 cm) was scanned using mAs mapping for
a whole Philips set and independently as a single test object. The
max difference was about 30 HU for the uniform object (expected
value of HU = -35HU). The worse result were received for the low-
er dose protocols. Clinically it means that for the different sizes of
patients image quality and noise contribution as well as quantity
parameters can be changed through the patient size.
The CIRS phantom was scanned using the protocols chosen
on the base the CATPHAN images. The results obtained during
testing showed a significant dispersion of the values and depen-
dence on the protocol setup, brain and torso protocols, filters
(UB and B), a place of the inserts in the CIRS phantom (the body
or head part of the phantom) and material density. The maxi-
mum differences were detected for the highest density mate-
rials: stainless steel 5918-7313 HU, titanium 5389-5989 HU, alu-
minum 1925-2038 HU. The variations of the HU values for the
materials simulated anatomical tissues were significantly lower,
eg.: high dense bone – 828-871 HU, low dense bone 173-205
HU, inhale lung - -776—802 HU. Al.l the chosen protocols were
scanned for the ACS protocols and the protocols with the fixed
mAs. The HU values obtained were not significantly different
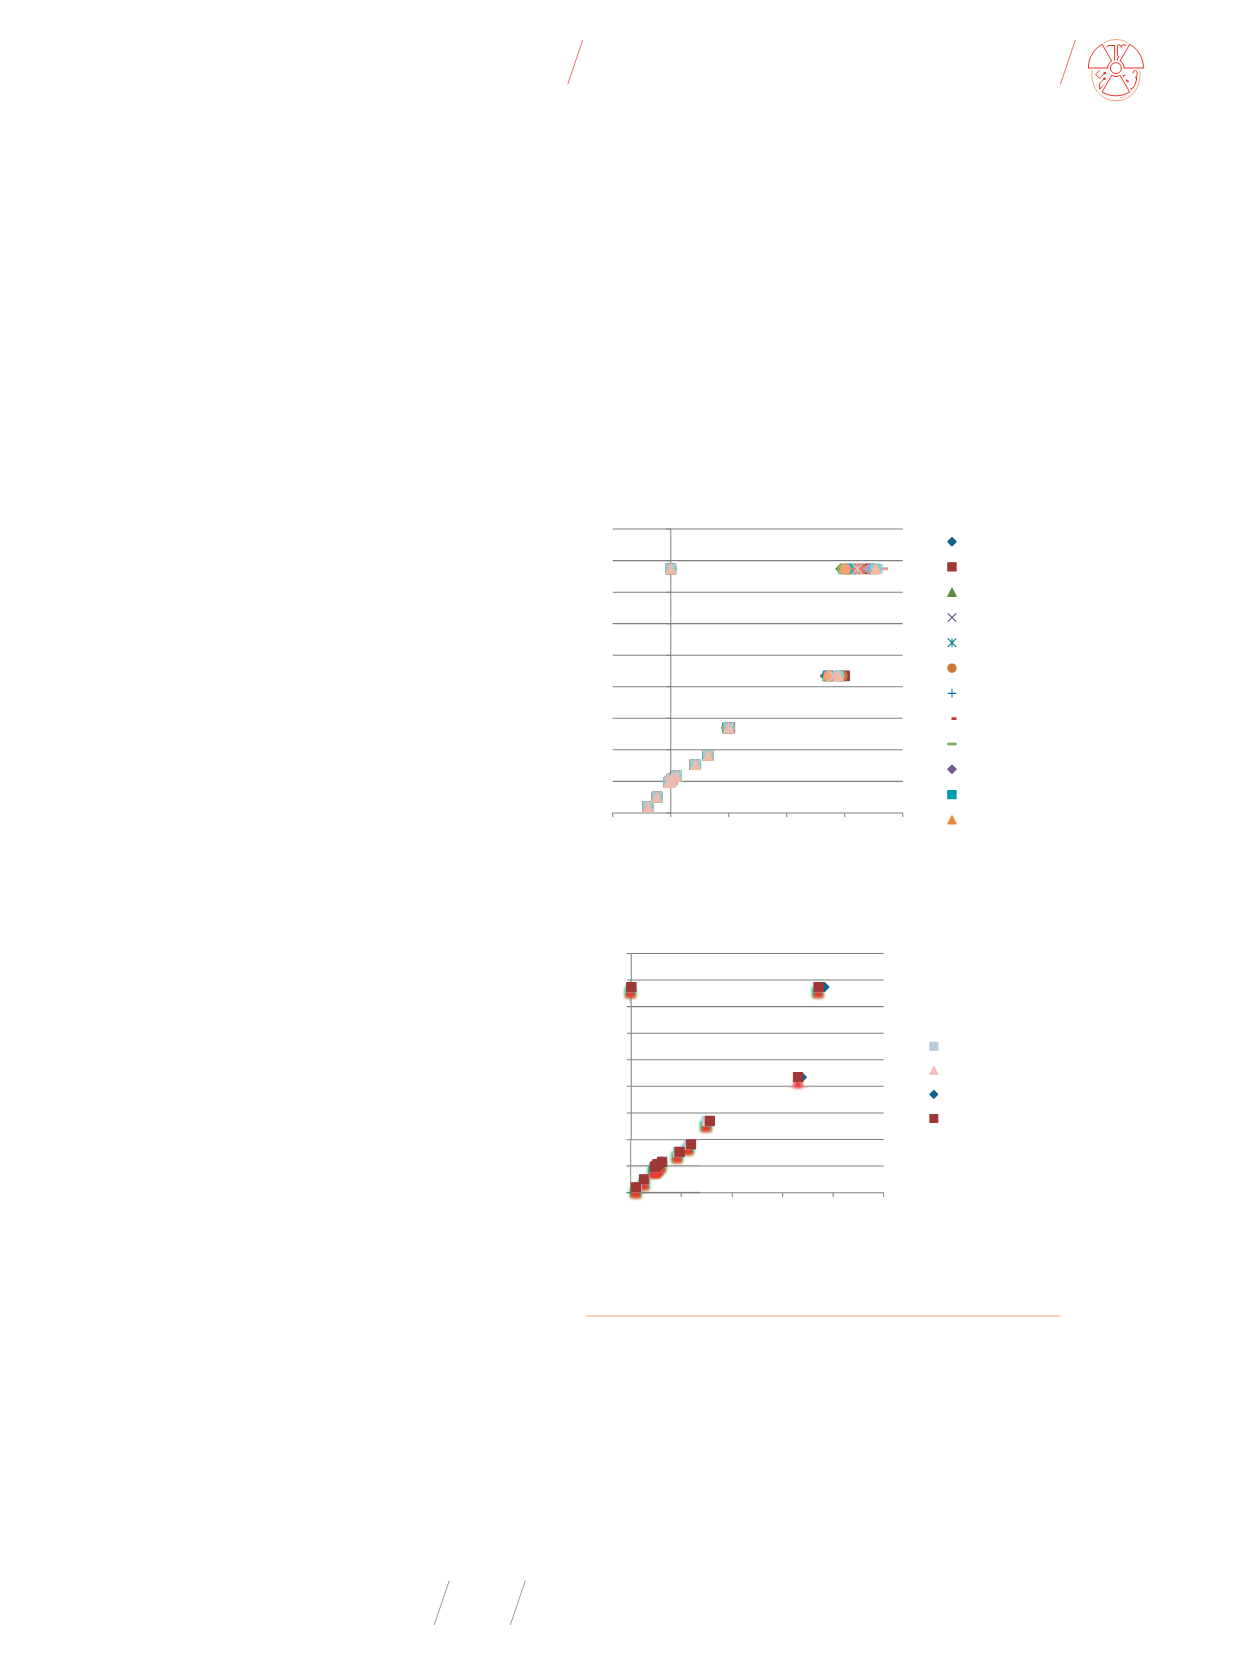
between the AEC and fixed setups. (Fig.5., Fig.6.)
The average values were calculated for all the HU values of
each material, scanned protocols and two CT systems installed
in the RT department (tab.4.). There was a compromise between
setting a few (physical density)=f(HU) graphs in the TPS and
a risk of making significant error by a choice not appropriate
calibration versus setting the one graph and manage uncertain-
ties in calculated dose. It was also determined by the variations
in the HU values which were already detected for the different
material positions in the phantom, long term variation, internal
and functional uncertainty of the CT scanner system itself. The
end-to-end tests confirmed finally goodness of that approach.
As a digression – a change of the filter from UB to B for the
brain and head protocols was not possible for the Phulips scan-
ner because of the predefined presets limiting user setups. The
filter B is only possible to use for the torso protocols.. The at-
tempt of changing UB filter to B filter for the brain protocol de-
termined also changing the reference image resulted changing
the image quality and quantity parameters.
0,000
1,000
2,000
3,000
4,000
5,000
6,000
7,000
8,000
9,000
‐2000,00 0,00 2000,00 4000,00 6000,00 8000,00
ACS vs fixed
brain ACS body
brains fixed body
brain ACS head
brain fixed head
brain ACS
brain fixed
abdo ACS body
abdo fixed body
abdo ACS head
abdo fixed head
abdo ACS
abdo fixed
0,000
1,000
2,000
3,000
4,000
5,000
6,000
7,000
8,000
9,000
0,00 2000,00 4000,00 6000,00 8000,00 10000,00
ACS vs fixed
Philips ACS
Philips fixed
TPS proposed firstly
Philips+Simenes final
Fig. 5
The CIRS phantom results for the chosen protocols
Fig. 6
The CIRS phantom results – average values - for all the chosen protocols
Conclusion
The ACS (AEC) system requires a very wide verification in rela-
tion to obtained image quality and quantity parameters before
signing off the CT scanner to clinic. It is very important in terms
of radiation therapy purposes and calculated dose during a plan-
ning process. The preformed tests showed that received results
were characterised by the significant variation dependently on
the different parameters/setting facilities/modalities used for
scanning and reconstruction.


